

2020 College football recruiting rankings and a bit of recruiting history on the HG
We started dropping the 2020 college football Hour Glass this week and while we are unsure of how the season will look, if we will have a season and more - we have marched on as if we will indeed have a season. Earlier this week, we dropped the initial article on the HG with power rankings and you can read that here.
We also got into a little coaching and you can read all about that here.
Next week we will get into win totals, and other things, but today - it’s all about the rosters and recruiting. It’s the age old question among fans, “do stars really matter?”
Some coaches and fans laud player development, while others will tell you it’s not the X’s and the O’s, but the Jimmy’s and the Joe’s.
We now have about 22 years’ worth of recruiting data from various sites to digest and if you look at the numbers of top end recruiters and National Championship games, the results are without question – recruiting matters.
This isn’t to suggest upsets don’t happen because they do, or some teams recruit well, but never meet expectations because that happens as well. But – if you ever want to even sniff a National Championship Game or the College Football Playoff, you better be serious about recruiting.
We went back 19 years and revisited every National Championship game through the BCS and the College Football Playoff and what we found wasn’t earth shattering. People have done this before, but we felt like the exercise was again necessary to remind people – numbers matter.
Starting with the 1998 National Championship game between Tennessee and Florida State, all the way, deep into the College Football Playoff, the numbers don’t lie regardless of the outlet you chose.
While outlets like 247sports, ESPN and Rivals may vary, the results at the top are the same. The top end recruiters on a three or four year average win and play for Championships.
That’s why recruiting is a major component to any numbers person in college football and why we use it as a major component in what we have done here.

Learn how Airaceuticals can help you - click image to see more great products
Outside of Virginia Tech in 1999 and Nebraska in 2001, all National Championship participants have recruited inside the top 20 on a four year average. Washington and Michigan State in back to back years had a chance to break this trend, early in the College Football Playoff, had they won their national semifinal games against Alabama. Both were between 27-30 on a four year recruiting average.
While someone may break this trend at some point along the way, the facts are clear up to this point. If you don’t recruit inside the top 15 in the country, you can just about kiss the National Championship goodbye, unless you have a game changer at quarterback like Cam Newton, Deshaun Watson or someone else.
People can predict dark horses for conferences annually and will, like Utah or an Oklahoma State - but when the rubber meets the road, those teams do not have the horses to get all the way through a college football season without getting dinged.
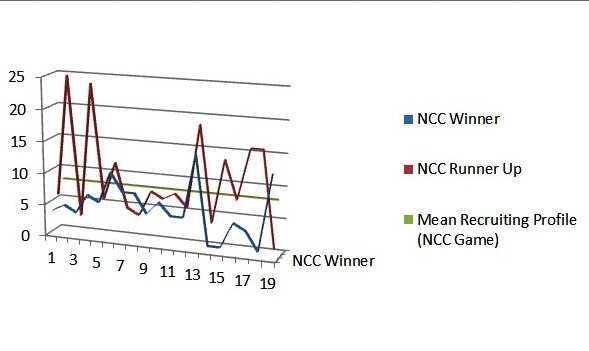
Here is what the year by year four year recruiting average of the National Championship participants looks like dating back to 1998 through 2017. The number ONE on the bottom scale represents 1998, while 19 represents 2017. The number on the left hand side represents four year recruiting class averages.

Here’s a second look at the same data via a line graph, with the numbers representing the same data and dates, but a mean recruiting trend regardless of winner or loser of the National Championship.
We created three tiers of recruiting within the Hour Glass this year to show which teams had a realistic chance on paper of obtaining certain goals.
Tier one are the teams that have the rosters to win the National Championship - Tier two are the teams who can make the playoff if everything else goes right, because they have the rosters to do so and Tier three is everyone else, who are literally playing for bowl positioning.
Note - just because you are in Tier one, it doesn’t mean we think you can win the title or will.
Below is the 2020 Tiers on our scale when it comes to roster talent.


